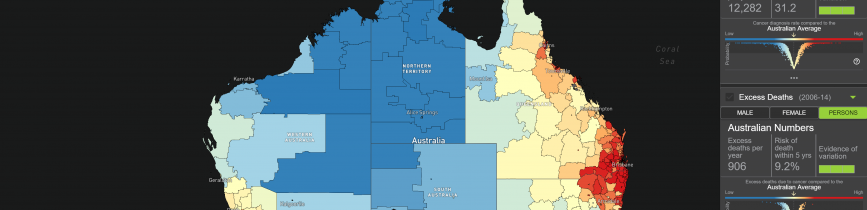
Australians can now discover the impact of cancer in their suburb or town, with the launch of a new cutting-edge Australian Cancer Atlas.
The interactive digital cancer atlas shows national patterns in cancer incidence and survival rates based on where people live for 20 of the most common cancers in Australia – such as lung, breast and bowel cancer – likely reflecting the characteristics, lifestyles and access to health services in the area.
This world-leading project, led by researchers from Cancer Council Queensland, Queensland University of Technology (QUT) and FrontierSI, will give health agencies and policy makers a better understanding of geographic disparities and health requirements across the country.
Cancer Council Queensland CEO, Ms Chris McMillan, said the charity was proud to launch the Australian Cancer Atlas in an effort to advance cancer control nationally.
“This project builds on years of work by Cancer Council Queensland to better understand the cancer divide between metropolitan and rural areas, and map the gaps linked to socio-economic status and other demographic factors,” Ms McMillan said.
“In 2018 an estimated 138,000 Australians will be diagnosed with cancer, but we know that some people face greater risks of diagnosis and death than others, due to a mix of lifestyle characteristics, behaviour, genetics and other unknown factors.
“The atlas enables readers to easily visualise those differences and offers critical insight into patterns of cancer and outcomes in Australia, depending on where people live, which can be used to drive research and policies going forward.”
Cancer Council Queensland Head of Research, Professor Joanne Aitken, said the digital atlas highlighted which geographical areas had cancer rates below or above the national average.
“Australians can filter down to look at the impact of various types of cancer in the region where they live, to understand cancer patterns across the country. However, it’s important to remember that local cancer trends won’t necessarily reflect your own cancer risk,” Prof Aitken said.
“Cancer rates vary across geographic regions depending on things like the age of local residents, participation in screening programs and trends in terms of cancer risk behaviours.
“Regardless of what is happening in our local area – we should each feel empowered to reduce our cancer risk by not smoking, being SunSmart, maintaining a healthy weight, reducing alcohol intake, exercising regularly, eating a healthy diet and getting checked.
“One of the most revealing patterns in the atlas was the severe disparities in Australia with liver cancer, with incidence rates significantly higher than the national average in many areas in Northern Australia and many metropolitan areas of Sydney and Melbourne, due to differences in the distribution of known risk factors such as hepatitis, intravenous drugs use and excess alcohol consumption.
“In addition, other findings confirm that melanoma incidence rates are higher than the Australian average in many areas of Queensland and northern New South Wales.”
Cancer Council Queensland Senior Research Fellow, Professor Peter Baade said excess death rates for many cancers continued to be higher in rural and remote areas of the country.
“There is still a long way to go to understand the reasons for all the geographic disparities but the atlas is designed to motivate and accelerate the pace of targeted research in areas that need it the most,” he said.
The estimates within the Australian Cancer Atlas were calculated using sophisticated statistical models and spatial analyses, developed by statisticians from QUT and Cancer Council Queensland, using data from each from the Australian state and territory Cancer Council registries.
The online atlas is powered by myGlobe, a state-of-the-art digital system that has been developed and enhanced specifically for the atlas by the Visualisation and eResearch team at QUT.
Distinguished Professor of Statistics at QUT and Deputy Director of the ARC Centre of Excellence for Mathematical and Statistical Frontiers (ACEMS), Professor Kerrie Mengersen said the atlas was designed to be user-friendly, with robust information and innovative visual presentations to help people interpret and understand the statistics.
“It can be added to and updated regularly so that all Australians can have access to the latest available information,” Prof Mengersen said.
“This project has been an exciting and rewarding one to work on, to build statistical models from the registry data gathered and to present this information in an easy-to-navigate, interactive tool.
“We believe the atlas will be an important resource, of benefit to all Australians, and hope it will drive policy and research so that we eliminate disparities across Australia in levels of cancer care, resourcing and survival.”
FrontierSI CEO Dr Graeme Kernich said the atlas has been a great success story in bringing together Cancer Council registries, universities, health departments and the Australian Institute of Health and Welfare to deliver an exceptional resource.
“This was an Australia-wide project linking different data sets to simply and seamlessly visualise the effects of cancer on our population through a spatial lens,” Dr Kernich said.
“It is promising for many areas of our digital economy just how well the team traversed the intersection of government and academia to deliver such an important piece of infrastructure.
“The online atlas visually tells a complex story simply, for anyone to explore.”
The Australian Cancer Atlas is a collaborative project developed by statisticians, cancer researchers, visualisation experts and IT specialists from Cancer Council Queensland, QUT and representatives from the Australian Institute of Health and Welfare, with additional input from government, community members, consumers and the media. The atlas has been endorsed by the Australasian Association of Cancer Registries and Cancer Council Australia, and investigators access expertise from the Australian Research Council (ARC) Centre of Excellence for Mathematical and Statistical Frontiers (ACEMS).
Australians can use the Australian Cancer Atlas at atlas.cancer.org.au.
More information about Cancer Council Queensland is available at cancerqld.org.au or Cancer Council’s 13 11 20.
Key statistics
- It’s estimated more than 138,000 new cases of cancer will be diagnosed nationally in 2018 – almost three times the number diagnosed in 1982.
- Cancer is a leading cause of death in Australia – more than 48,000 deaths from cancer are estimated for 2018. In 2014, cancer was the second most common cause of death in Australia and accounted for about 3 in 10 deaths.
- Around 17,500 more people die each year from cancer than 30 years ago, this is due mainly to population growth and ageing. However, the death rate (number of deaths per 100,000 people) has fallen by more than 24%.
- 69% of people diagnosed with cancer in Australia are still alive five years after a cancer diagnosis.
- The most common cancers in Australia (excluding non-melanoma skin cancer) are prostate, breast, colorectal (bowel), melanoma and lung cancer. These five cancers account for around 60% of all cancers diagnosed in Australia.
- Cancer costs more than $4.5 billion in direct health system costs (6.9%).
- Compared with major cities, people living in very remote areas of Australia are 1.2 times more likely to die from all cancers combined.
Media contacts
For interviews with Cancer Council Queensland representatives contact:
Abby Page, Advisor, Public Relations, Cancer Council Queensland M. 0428 580 363 E. media@cancerqld.org.au
For interviews with Queensland University of Technology representatives contact:
Karen Milliner, Communications Officer P. (07) 3138 1841 E: k.milliner@qut.edu.au
For interviews with FrontierSI representatives contact:
Stephanie Pradier, Communications Manager M. 0424 568 314 E: spradier@frontiersi.com.au
Contact the Australian Cancer Atlas
Submit your enquiry here.